Back to Articles Image Of The Day

Your Year in the Sky: A Time-Lapse Journey Above the Netherlands

📖 3 min read 📊 beginner 🏷️ NASA APOD

In Brief

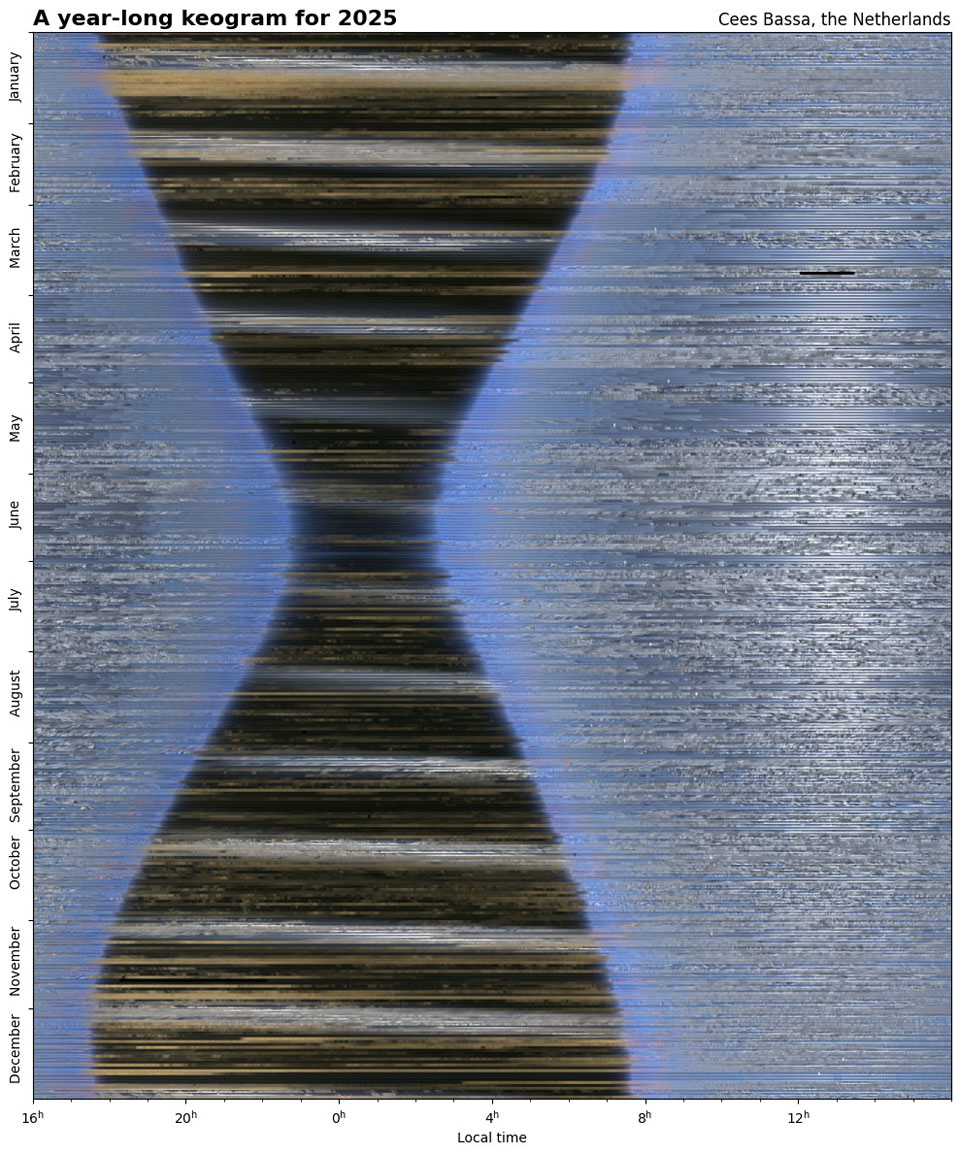
Imagine seeing an entire year's worth of sky, from every angle, condensed into one mesmerizing image! This unique 'keogram' captures every 15 seconds of the sky over the Netherlands, revealing the dance of day and night, the moon's glow, and the changing seasons all in a single glance.
Your Year in the Sky: A Time-Lapse Journey Above the Netherlands

The Full Story

What if you could press rewind and fast forward, experiencing a whole year of sky in mere moments? That's precisely what a 'keogram' offers – a breathtaking condensation of time, presenting the complete sky above the Netherlands for an entire year (specifically, 2025, in this case) into one astonishing image. This isn't just a pretty picture; it's a powerful visual story of our planet's relentless motion, from its daily spin to its annual journey around the Sun. The creation of this sky-spanning masterpiece involved some clever technology and data processing. Imagine a special camera, much like a super wide-angle 'fish-eye' lens, positioned to capture the entire dome of the sky above the Netherlands. This all-sky camera snapped a photo every 15 seconds, day and night, for 365 days. To create the keogram, scientists then took a narrow, central vertical strip from each of these thousands of images and carefully aligned them side-by-side. The result is a continuous timeline: January starts at the very top of the image, gradually transitioning through the months, until December concludes at the bottom, with the darkest part of the night running just left of the center line. Once assembled, the keogram unveils a wealth of astronomical insights. Most obviously, the daytime sky is a brilliant blue ribbon, while the nighttime appears as a vast expanse of black. However, nestled within the night, you can spot twelve distinct, lighter bands. These luminous stripes are caused by the glow of the Moon as it waxes and wanes through its phases, illuminating the night sky at various times throughout the year. Each band represents a lunar cycle, showcasing the Moon's ever-changing presence in our heavens. Perhaps the most striking feature is the distinctive black 'hourglass' shape cutting through the middle of the image. This shape beautifully illustrates the changing length of day and night throughout the year. The thinnest part of the hourglass, where the black band representing night is narrowest, corresponds to the summer solstice – the longest day of the year. Conversely, the thickest part of the hourglass reveals the winter solstice, marking the shortest day and longest night. The points where the blue and black sections appear roughly equal in width signify the spring and autumn equinoxes, when day and night are nearly balanced. This keogram isn't just a static image; it's a dynamic demonstration of fundamental astronomical principles. It visually explains the Earth's rotation on its axis, which gives us day and night, and its orbit around the Sun, which, combined with the Earth's axial tilt, dictates our seasons. By condensing a year of observation into a single frame, it makes these complex celestial mechanics incredibly intuitive and accessible, reminding us of the cosmic ballet constantly unfolding above our heads.

Key Takeaways

  • 1 A 'keogram' is a unique time-lapse image that compresses an entire year of sky observations into a single, comprehensive visual.
  • 2 It clearly illustrates Earth's daily rotation, its yearly orbit around the Sun, and the Moon's phases through changes in light and darkness.
  • 3 Key astronomical events like solstices and equinoxes are vividly depicted by the changing proportions of day and night in the image's 'hourglass' shape.

💡 Think of it this way:

It's like taking a thin vertical slice from countless photos, one after another, and then stitching them together to create a continuous 'sky ribbon' of time, showing an entire year unfold before your eyes.

How We Know This

Scientists used a special 'all-sky' camera, which acts like a giant fish-eye lens, capturing the entire dome of the sky. It snapped a picture every 15 seconds for a whole year. Then, they digitally extracted a thin vertical slice from the center of each image and stitched them all together, creating a continuous timeline of the sky from January at the top to December at the bottom.

What This Means

This kind of long-term sky monitoring can help us understand local atmospheric conditions, detect changes in light pollution, and even track phenomena like aurora activity over time. Beyond scientific data, keograms are powerful tools for public engagement, making complex astronomical cycles incredibly easy to visualize and appreciate. They inspire curiosity about our place in the cosmos and could be used to compare sky views from different locations around the globe, revealing regional variations in climate and celestial events.

Why It Matters

This stunning visualization helps us truly grasp Earth's daily spin and yearly orbit, revealing how our perspective of the sky changes with the seasons and the phases of the Moon, fostering a deeper connection to the cosmos we live within.

Related Topics

#astronomy #time-lapse #keogram #seasons #skywatching